Python - Functions & Plotting
Objectives:
- Discover functions and apply functions.
- Plot simple graphs from data.
Functions
Often, we want to do more than add, subtract, multiply, and divide values of data.
NumPy knows how to do more complex operations on arrays.
If we want to find the average inflammation for all patients on all days,
for example,
we can ask NumPy to compute data’s mean value:
print(numpy.mean(data))
mean is a function that takes an array as an argument.
If variables are nouns, functions are verbs: they do things with variables.
Not All Functions Have Input
Generally, a function uses inputs to produce outputs. However, some functions produce outputs without needing any input. For example, checking the current time doesn’t require any input.
import time
print(time.ctime())
For functions that don’t take in any arguments, we still need parentheses (
()) to tell Python to go and do something for us.
NumPy has lots of useful functions that take an array as input. Let’s use three of those functions to get some descriptive values about the dataset. We’ll also use multiple assignment, a convenient Python feature that will enable us to do this all in one line.
maxval, minval, stdval = numpy.max(data), numpy.min(data), numpy.std(data)

print('maximum inflammation:', maxval)
print('minimum inflammation:', minval)
print('standard deviation:', stdval)
Mystery Functions in IPython
How did we know what functions NumPy has and how to use them? If you are working in the IPython/Jupyter Notebook there is an easy way to find out. If you type the name of something with a full-stop then you can use tab completion (e.g. type
numpy.and then press tab) to see a list of all functions and attributes that you can use. After selecting one you can also add a question mark (e.g.numpy.cumprod?) and IPython will return an explanation of the method! This is the same as doinghelp(numpy.cumprod).
When analyzing data, though, we often want to look at partial statistics, such as the maximum value per patient or the average value per day. One way to do this is to create a new temporary array of the data we want, then ask it to do the calculation:
patient_0 = data[0, :] # 0 on the first axis, everything on the second
print('maximum inflammation for patient 0:', patient_0.max())
Comments in Python
Everything in a line of code following the ‘#’ symbol is a comment that is ignored by the computer. Comments allow programmers to leave explanatory notes for other programmers or their future selves.
We don’t actually need to store the row in a variable of its own. Instead, we can combine the selection and the function call:
print('maximum inflammation for patient 2:', numpy.max(data[2, :]))
What if we need the maximum inflammation for each patient over all days (as in the next diagram on the left), or the average for each day (as in the diagram on the right)? As the diagram below shows, we want to perform the operation across an axis:
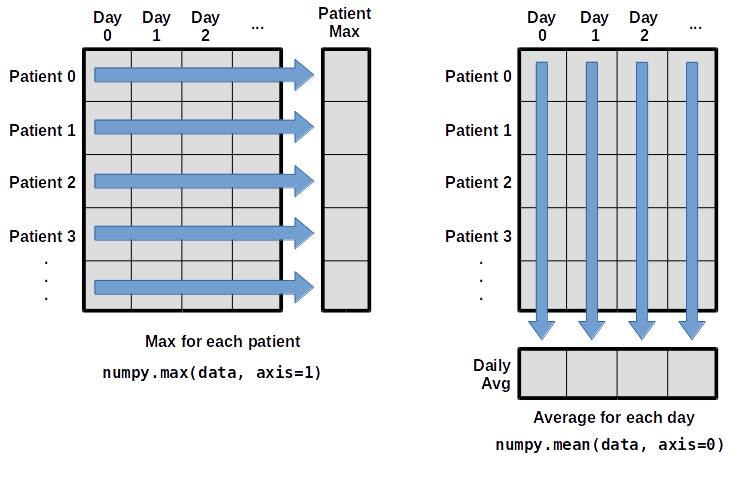
To support this, most array functions allow us to specify the axis we want to work on. We can ask for the average across axis 0 (rows in our 2D example):
print(numpy.mean(data, axis=0))
As a quick check, we can ask this array what its shape is:
print(numpy.mean(data, axis=0).shape)
The expression (40,) tells us we have an N×1 vector,
so this is the average inflammation per day for all patients.
We can average across axis 1 (columns in our 2D example):
print(numpy.mean(data, axis=1))
which is the average inflammation per patient across all days.
Exercise - Change in Inflamation
This patient data is longitudinal in the sense that each row represents a series of observations relating to one individual. This means that change inflamation is a meaningful concept.
The
numpy.diff()function takes a NumPy array and returns the difference along a specified axis.Which axis would it make sense to use this function along?
Solution
Since the row axis (0) is patients, it does not make sense to get the difference between two arbitrary patients. The column axis (1) is in days, so the differnce is the change in inflamation – a meaningful concept.
numpy.diff(data, axis=1)If the shape of an individual data file is
(60, 40)(60 rows and 40 columns), what would the shape of the array be after you run thediff()function and why?Solution
The shape will be
(60, 39)because there is one fewer difference between columns than there are columns in the data.How would you find the largest change in inflammation for each patient? Does it matter if the change in inflammation is an increase or a decrease?
Solution
By using the
numpy.max()function after you apply thenumpy.diff()function, you will get the largest difference between days.numpy.max(numpy.diff(data, axis=1), axis=1)array([ 7., 12., 11., 10., 11., 13., 10., 8., 10., 10., 7., 7., 13., 7., 10., 10., 8., 10., 9., 10., 13., 7., 12., 9., 12., 11., 10., 10., 7., 10., 11., 10., 8., 11., 12., 10., 9., 10., 13., 10., 7., 7., 10., 13., 12., 8., 8., 10., 10., 9., 8., 13., 10., 7., 10., 8., 12., 10., 7., 12.])If a difference is a decrease, then the difference will be negative. If you are interested in the magnitude of the change and not just the direction, the
numpy.absolute()function will provide that.Notice the difference if you get the largest absolute difference between readings.
numpy.max(numpy.absolute(numpy.diff(data, axis=1)), axis=1)array([ 12., 14., 11., 13., 11., 13., 10., 12., 10., 10., 10., 12., 13., 10., 11., 10., 12., 13., 9., 10., 13., 9., 12., 9., 12., 11., 10., 13., 9., 13., 11., 11., 8., 11., 12., 13., 9., 10., 13., 11., 11., 13., 11., 13., 13., 10., 9., 10., 10., 9., 9., 13., 10., 9., 10., 11., 13., 10., 10., 12.])
Plotting
While there is no “official” plotting library, Python’s matplotlib is the de facto standard.
First, we will import the matplotlib module
and use two of its functions to create and display a heat map of our data:
import matplotlib
%matplotlib inline
image = matplotlib.pyplot.imshow(data)
matplotlib.pyplot.show()

Blue regions in this heat map are low values, while red shows high values. As we can see, inflammation rises and falls over a 40-day period.
Some IPython Magic
If you’re using an IPython / Jupyter notebook, you’ll need to execute the following command in order for your matplotlib images to appear in the notebook when
show()is called:%matplotlib inlineThe
%indicates an IPython magic function - a function that is only valid within the notebook environment. Note that you only have to execute this function once per notebook.
Let’s take a look at the average inflammation over time:
ave_inflammation = numpy.mean(data, axis=0)
ave_plot = matplotlib.pyplot.plot(ave_inflammation)
matplotlib.pyplot.show()

Here, we have put the average per day across all patients in the variable ave_inflammation,
then asked matplotlib.pyplot to create and display a line graph of those values.
The result is roughly a linear rise and fall, which is suspicious:
based on other studies, we expect a sharper rise and slower fall.
Let’s have a look at two other statistics:
max_plot = matplotlib.pyplot.plot(numpy.max(data, axis=0))
matplotlib.pyplot.show()

min_plot = matplotlib.pyplot.plot(numpy.min(data, axis=0))
matplotlib.pyplot.show()

The maximum value rises and falls perfectly smoothly, while the minimum seems to be a step function. Neither result seems particularly likely, so either there’s a mistake in our calculations or something is wrong with our data. This insight would have been difficult to reach by examining the data without visualization tools.
You can group similar plots in a single figure using subplots.
This script below uses a number of new commands. The function matplotlib.pyplot.figure()
creates a space into which we will place all of our plots. The parameter figsize
tells Python how big to make this space. Each subplot is placed into the figure using
its add_subplot method. The add_subplot method takes 3 parameters. The first denotes
how many total rows of subplots there are, the second parameter refers to the
total number of subplot columns, and the final parameter denotes which subplot
your variable is referencing (left-to-right, top-to-bottom). Each subplot is stored in a
different variable (axes1, axes2, axes3). Once a subplot is created, the axes can
be titled using the set_xlabel() command (or set_ylabel()).
Here are our three plots side by side:
fig = matplotlib.pyplot.figure(figsize=(10.0, 3.0))

axes1 = fig.add_subplot(1, 3, 1)
axes2 = fig.add_subplot(1, 3, 2)
axes3 = fig.add_subplot(1, 3, 3)

axes1.set_ylabel('average')
axes1.plot(numpy.mean(data, axis=0))

axes2.set_ylabel('max')
axes2.plot(numpy.max(data, axis=0))

axes3.set_ylabel('min')
axes3.plot(numpy.min(data, axis=0))

fig.tight_layout()
matplotlib.pyplot.show()

The call to loadtxt reads our data,
and the rest of the program tells the plotting library
how large we want the figure to be,
that we’re creating three subplots,
what to draw for each one,
and that we want a tight layout.
(Perversely, if we leave out that call to fig.tight_layout(),
the graphs will actually be squeezed together more closely.)
Exercise - Make your Own Plot
Create a plot showing the standard deviation (
numpy.std) of the inflammation data for each day across all patients.Solution
std_plot = matplotlib.pyplot.plot(numpy.std(data, axis=0))
matplotlib.pyplot.show()
Scientists Dislike Typing
We will always use the syntax
import numpyto import NumPy. However, in order to save typing, it is often suggested to make a shortcut like so:import numpy as np. If you ever see Python code online using a NumPy function withnp(for example,np.loadtxt(...)), it’s because they’ve used this shortcut. When working with other people, it is important to agree on a convention of how common libraries are imported.
Key Points:
- Use
# some kind of explanationto add comments to programs. - Use
numpy.mean(array),numpy.max(array), andnumpy.min(array)to calculate simple statistics. - Use
numpy.mean(array, axis=0)ornumpy.mean(array, axis=1)to calculate statistics across the specified axis. - Use the
pyplotlibrary frommatplotlibfor creating simple visualizations.
| Previous: Python - Numpy and Arrays | Top: Python Overview | Next: Python - Repeating Actions with Loops |